Why Haven’t Loan Officers Been Told These Facts? ADU Rental Income
FNMA has introduced a program enhancement for calculating ADU income on the subject property. This change is effective immediately for manually underwritten loans; however, it has not yet been reflected in DU.
Identifying niche circumstances is a way to segment consumer markets, addressing specific needs while also providing a marketing entry point into larger markets.
For example, qualifying a buyer with income from an accessory dwelling unit (ADU) or a boarder. While individuals who rely on ADU or boarder income to qualify for financing may represent a relatively small market segment, it’s important to note that the end-users of the product do not solely define the market you are entering. In addition to enhancing your professional reputation, you are also marketing to the community of every applicant you assist.
Most of the country is still dealing with significant inventory constraints. However, as housing stock increases in some areas, listing agents will face new challenges in servicing their listings. Unique property configurations provide an opportunity for originators to distinguish themselves from competitors by offering real estate agents novel, innovative, or technical solutions.
From the FNMA SEL-2025-08
We amended our rental income policy to allow income from an ADU to be considered towards qualifying income provided all the following requirements are met:
- The property must be a one-unit, principal residence and is limited to purchase and limited cash-out refinance transactions.
- The rental income may only be derived from one ADU even if multiple ADUs exist.
- The amount of rental income used for qualifying purposes from the ADU is limited to 30% of the borrower’s total qualifying income.
Effective: Desktop Underwriter® (DU®) version 12.1 will be updated in Q1 2026, to include eligibility for ADU rental income.
Lenders may implement these changes immediately for loans that are eligible for manual underwriting.
FNMA SEL-2025-08 Rental Income
FHLMC Rental Income From an ADU
BEHIND THE SCENES: Foreclosure Activity on the Rise
IRVINE, Calif. — September 11, 2025 — ATTOM, a leading curator of land, property data, and real estate analytics, today released its August 2025 U.S. Foreclosure Market Report, which shows there were a total of 35,697 U.S. properties with foreclosure filings— default notices, scheduled auctions or bank repossessions — down 1 percent from a month ago but up 18 percent from a year ago.
“August marked the sixth consecutive month of year-over-year increases in U.S. foreclosure activity and the third straight month with double-digit annual growth,” said Rob Barber, CEO at ATTOM. “While overall levels remain below those seen before the pandemic, the ongoing rise in both foreclosure starts and completions suggests that some homeowners may be experiencing added financial strain in the current high-cost and high-interest-rate environment.”
The worst foreclosure rates were in Nevada, South Carolina, and Florida
Nationwide, one in every 3,987 housing units had a foreclosure filing in August 2025. States with the worst foreclosure rates were Nevada (one in every 2,069 housing units with a foreclosure filing); South Carolina (one in every 2,152 housing units); Florida (one in every 2,512 housing units).
Among the 225 metropolitan statistical areas with a population of at least 200,000, those with the worst foreclosure rates in August 2025 were Lakeland, FL (one in every 1,212 housing units with a foreclosure filing); Columbia, SC (one in every 1,347 housing units); Chico, CA (one in every 1,545 housing units); Cleveland, OH (one in every 1,755 housing units); and Ocala, FL (one in every 1,816 housing units).
Those major metropolitan areas with a population greater than 1 million with the worst foreclosure rates in August 2025 besides Cleveland were: Las Vegas, NV (one in every 1,817 housing units); Jacksonville, FL (one in every 2,057 housing units); Houston, TX (one in every 2,195 housing units); and Orlando, FL (one in every 2,210 housing units).
Texas, Florida, and California led the nation in foreclosure starts
Lenders started the foreclosure process on 24,254 U.S. properties in August 2025, down slightly at 0.2 percent from last month but up 16.9 percent from a year ago.
States that had the greatest number of foreclosure starts in August 2025 included: Texas (2,982 foreclosure starts); Florida (2,803 foreclosure starts); California (2,558 foreclosure starts); New York (1,207 foreclosure starts); and Illinois (1,170 foreclosure starts).
Those major metropolitan areas with a population greater than 1 million that had the greatest number of foreclosure starts in August 2025 included: New York, NY (1,431 foreclosure starts); Houston, TX (1,178 foreclosure starts); Chicago, IL (1,009 foreclosure starts); Los Angeles, CA (862 foreclosure starts); and Miami, FL (748 foreclosure starts).
Foreclosure completions up from same time last year
Lenders repossessed 4,077 U.S. properties through completed foreclosures (REOs) in August 2025, an increase of 5 percent from last month and an increase of 41 percent from last year.
States that had the greatest number of REOs in August 2025, included: Texas (476 REOs); California (343 REOs); New York (319 REOs); Florida (276 REOs); and Illinois (232 REOs).
Those major metropolitan statistical areas (MSAs) with a population greater than 1 million that saw the greatest number of REOs in August 2025 included: Chicago, IL (159 REOs); New York, NY (137 REOs); Houston, TX (109 REOs); San Antonio, TX (96 REOs); and Dallas, TX (79 REOs).
Conclusion
The August 2025 U.S. Foreclosure Market Report reveals a continued upward trend in foreclosure activity, marking the sixth consecutive month of year-over-year growth and the third straight month of double-digit increases. A total of 35,697 U.S. properties had foreclosure filings during the month, representing an 18% increase compared to August 2024, despite a slight 1% decline from July 2025. Both key components of foreclosure activity rose year over year: foreclosure starts jumped 17% to over 24,000 filings, while completed foreclosures (REOs) surged 41%, totaling more than 4,000 nationwide. Despite remaining below pre-pandemic levels, the persistent rise in both foreclosure starts and completions may signal increasing financial strain for some homeowners amid elevated home prices and interest rates.
FHFA 2nd Quarter Foreclosure and Refinance Report
Tip of the Week – Sign Up for 2025 CE
Expanding your product offerings is an effective way to enhance your business’s vitality. This year, the Loan Officer School is surveying non-government financing options for construction and renovation projects.
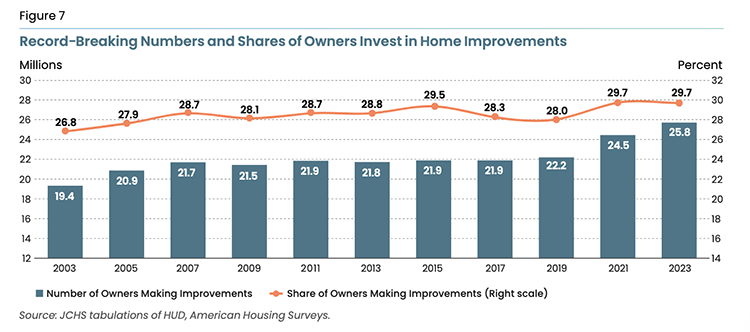
The shortage of affordable housing is unlikely to be resolved anytime soon. As affordable, move-in-ready housing solutions remain hard to find, the demand for construction and renovation loans is expected to increase. According to the JCHS, Harvard University, the US remodeling market soared above $600 billion in the wake of the pandemic and, despite recent softening, remains 50 percent above pre-pandemic levels.
Discover how to enhance borrower advantages through construction and renovation financing.
- Enhanced housing affordability.
- Housing options for aging or disabled borrowers.
- Housing solutions for borrowers caring for aging or disabled family members.
- Multi-generational housing solutions.
For any questions or inquiries regarding state education needs, please feel free to call.
Call Us Today! (866) 314-7586
Sign up for a 2025 CE Webinar
Online self-study classes are available.