Why Haven’t Loan Officers Been Told These Facts?
Loan Presentations – Three-Point Loan Comparison
While many MLOs appreciate the nexus between payment and term, fewer comprehend the amortization trajectory relative to the interest rate. Yet, the interest rate, like term and payment, is a critical variable in calculating the pace of amortization. The amortization trajectory can materially impact the consumer’s cost of financing.
For example, two 30-year loans, the first at 6.00% and the second at 5.50%, amortize at different speeds and thus may impact the borrowers’ financing costs. Nationally, according to recent research by the National Association of Realtors (NAR) and Redfin, homeowners keep their homes for an average of 12-13 years. However, that average is specific to owning the home, not the duration of the purchase money financing. Considering the cyclical nature of interest rates, over 13 years, it is probable that many homeowners could refinance at least once. The exception might be those folks that obtained financing during the historically low rates of the pandemic era.
Additionally, the average time in the home varies significantly by region and demographic. See the links below. While the mandatory TILA disclosures are helpful, MLOs can further illustrate potential financing charges tailored to the unique plans and circumstances of the consumer. Specifically, what are the calculated loan costs for tenors (periods) of less than 30 years? Hence, illustrating the projected loan payoff after three, five, seven, or ten years may provide valuable insights into the cost of credit, including the impact of accelerated amortization at lower interest rates.
A good loan presentation might include a range of illustrations incorporating time values to better inform consumers of the cost of credit and how costs are derived. Furthermore, this little-known fact about rate-driven amortization renders many loan origination presentations inaccurate and possibly self-defeating.
Triangulate the Presentation
The “Three-Point” illustration combines the well-understood nexus of rate and fees with the lesser-known nexus of amortization and interest rate. Accordingly, the triangular cost presentation adds “projected payoff” to the calculus of upfront fees and P&I payment. This simple yet powerful technique amplifies financing cost clarity.
Fixed-Rate Smoke and Mirrors
Many consumers AND MLOs need to appreciate the potential premium consumers pay for 30-year fixed-rate mortgages. The interest rate game is in flux after years of relatively stable fixed rates.
Consequently, borrowers are unnecessarily increasing the risk of overpaying the financing costs because they fail to recognize the costs of mortgages. Couple the consumer’s lack of comprehension with fear and ignorance, and presto, you get an uninformed loan product and feature selection. Unfortunately, the shaky loan presentation does little to help these folks comprehend their best financing bet.
When the options lack a clear, quantified benefit, consumers and MLOs risk an expected knee-jerk and mindless default to the fixed rate as the “safe” or “conservative” option when in many cases, it is neither.
Considering this, might one suggest that the fixed-rate mortgage is a rare manifestation of Wall Street giving away money to unsophisticated borrowers?
Since most loans pay off well before the end of the term, MLOs might consider adding projected payoff as a variable to their loan presentation.
Accuracy Versus Simplicity
The fundamentals of a return on investment (ROI) or cost-benefit analysis (CBA) can be complicated. However, some simple yet accurate methods to assess financing costs exist.
The rough basics:
- First, identify the non-recurring (costs unique to the refinance) origination fees and finance charges as may be appropriate for a given mortgage
- Determine the measurement periods as suggested by the prospect (E.g., Payoff in five years)
- Next, for a refinance, the cost comparison is between the current financing and the proposed or future financing
- For a purchase, the cost comparison involves two or more hypothetical loans
- Lastly, juxtapose the comparison loans to identify the differences in finance charges
Some states and some loan programs, such as VA and FHA, require loan comparisons to establish a tangible net benefit for limited cash-out refinances.
Whether the analysis is for purchase money or a limited cash-out refinance, the projected payoff balances quantify potential financing costs relative to specific customer-driven inputs (E.g., We plan to keep the loan for less than five years).
It would help if you had a financial calculator, spreadsheet, LOS, or any reliable online amortization tool. For example, your LOS may provide amortization projections. Spreadsheets are also programmable to run amortization values.
Break It Down, “Stars and shadows ain’t good to see by”
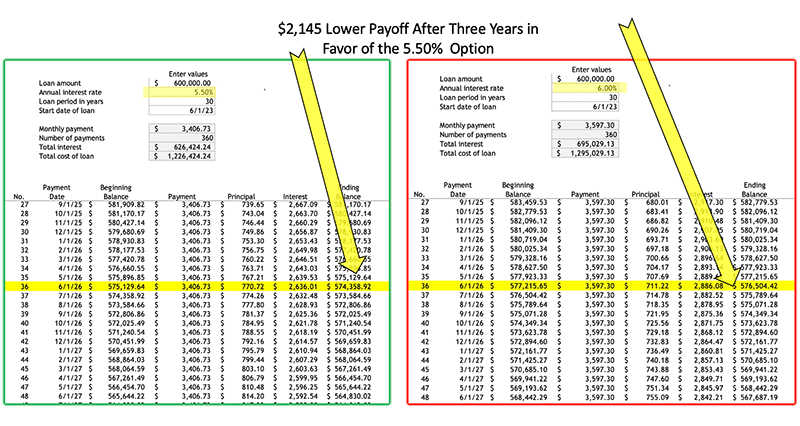
In the example, two loans are amortized at different rates based on a 50 BPS rate spread. Note in Figure 1.0 that a $600,000 loan with a 50 BPS rate spread has a $2,145 payoff difference after 36 months in favor of the 5.50% rate.
The 5.50% quote also provides for significantly lower P&I payments providing monthly savings of $190.57. The projected monthly P&I savings at the end of 36 months is $6,860. Coupled with the $2,145 lower payoff, the 50 BPS lower rate saves the borrower a total of $9,005 compared to the 6.00 rate. However, the 5.50% option does not look like a “good deal” for the borrower in light of the total financing charges. The 5.50% rate carries a $12,000 discount making for $12,000 in higher prepaid finance charges. Therefore the 6.00% loan costs are $2,995 less than those at 5.50%, right?
Not so fast, Huckleberry. What about the opportunity cost of the rate discount?
Next week, how to factor opportunity costs into the equation.
Do you have a great value proposition you’d like to get in front of thousands of loan officers? Are you looking for talent?

BEHIND THE SCENES – LIBOR, The Long Goodbye
CFPB Joins Other Financial Regulatory Agencies in Issuing Statement on Completing the LIBOR Transition
Sunset of LIBOR as a reference rate for many financial products may pose risks to borrowers
WASHINGTON, D.C. – Today, the Consumer Financial Protection Bureau (CFPB) joined four other federal financial regulatory agencies, along with state bank and state credit union regulators, in issuing a statement that the use of United States Dollar LIBOR (USD LIBOR) panels will end on June 30, 2023. The statement reiterates the agencies’ expectations that financial institutions with USD LIBOR exposure should complete their transition of remaining LIBOR contracts as soon as practicable. Accordingly, the CFPB is urging banks and nonbanks alike to continue their efforts to adequately prepare for the sunset of USD LIBOR.
The financial services industry uses USD LIBOR as a reference interest rate for many consumer financial products, including adjustable rate mortgage loans, reverse mortgages, home equity lines of credit, credit cards, and student loans. The approaching discontinuation of USD LIBOR in June 2023 presents numerous consumer protection, financial, litigation, and operational risks. For instance, if financial institutions do not issue required disclosures, consumers may not know when the transition from USD LIBOR will occur or how the interest rates they pay will be calculated.
Both banks and nonbanks use USD LIBOR in setting consumer credit interest rates. Nonbanks have increasingly become involved in the issuance of consumer credit. For instance, nonbank mortgage lenders originated nearly two-thirds of loans for home purchasers in 2021. The CFPB is committed to helping both banks and nonbanks transition affected consumers from USD LIBOR in a transparent and orderly manner.
In October 2019 and December 2021, the CFPB published blog posts discussing the transition away from USD LIBOR to help consumers understand this market-wide change. In June 2020, the CFPB released an updated Consumer Handbook on Adjustable-Rate Mortgages to help consumers better understand these products and how their payments can change over time.
On December 7, 2021, the CFPB finalized a rule revising Regulation Z (Truth in Lending Act) to facilitate the transition away from the USD LIBOR interest rate index for consumer loans. The rule establishes requirements for how creditors must select replacement indices for existing USD LIBOR-linked consumer loans after April 1, 2022. The CFPB is currently assessing any further steps it needs to take as a result of the subsequent Adjustable Interest Rate Act and the Federal Reserve Board’s implementing regulation identifying benchmark rates based on the Secured Overnight Financing Rate (SOFR) to replace USD LIBOR in certain consumer contracts.
Tip of the Week – Sign up for 2023 CE
Webinars start June 1
Special Information Booklets
The Good, The Bad, and The Ugly
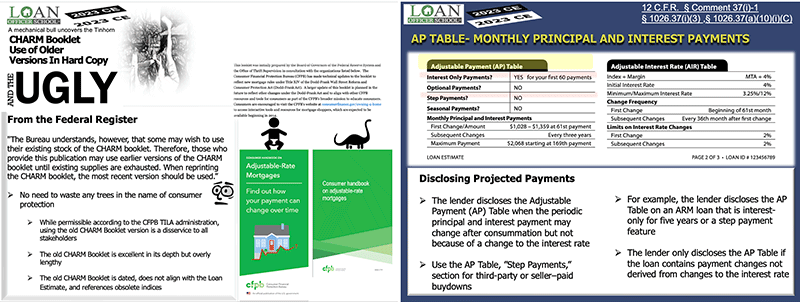
Join us for a comprehensive review of ARM disclosure and terminology. For those unfamiliar with ARMs, check out the CHARM Booklet before the CE class. Our main objective is to promote MLO confidence through competence. By attending the 2023 CE, you’ll better understand the early and generic disclosure requirements for ARMs.
It is strongly advised that you discard outdated hardcopy CHARM Booklets and embrace the newer version, which is much easier to read and in line with contemporary indices and the Loan Estimate. Recycling the old booklets is the appropriate way to dispose of them.
While the updated CHARM Booklet is an improvement in ways, there is still room for enhancement. Therefore, we urge you to participate in this year’s 2023 CE Course to review the CHARM Booklet thoroughly. The Good, The Bad and The Ugly.