Why Haven’t Loan Officers Been Told These Facts?
Factoring “Opportunity Cost” Into the Loan Presentation, Break It Down, “Stars and shadows ain’t good to see by”
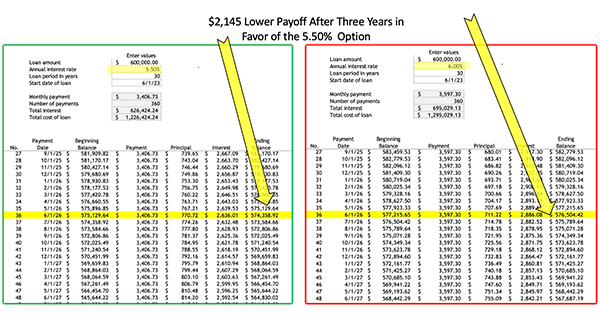
Last week, the Journal fleshed out a three-point loan analysis to improve the accuracy and clarity of loan comparisons. Indeed, not only do monthly payments and loan terms effect amortization, but the interest rate is also a critical variable in calculating the pace of amortization. Consequently, the amortization trajectory can materially impact the consumer’s cost of financing. In the example, the two 30-year loans amortize at two different interest rates, one at 5.50% and the other at 6.00%. Notably, after only 36 months (Figure 1.0), the $600,000 loan with the 50 BPS lower rate has a $2,145 lower payoff.
The 5.50% quote also provides significantly lower P&I payments providing monthly savings of $190.57. The projected monthly P&I savings at the end of 36 months is $6,860. At 5.50%, the lower payoff and monthly payments save the borrower $9,005 compared to the 6.00% rate.
However, the 5.50% option does not look like a “good deal” for the borrower in light of the costs. The 5.50% rate carries a $12,000 discount. Thus by accounting for the discount cost, the 6.00% loan costs are $2,995 less than the 5.50% loan. Right?
Not so fast, Huckleberry. What about the opportunity cost of the rate discount? Should the applicant choose the 5.50% option, they have lost the use of the $12,000 paid for the permanent buydown (discount). Therefore, the opportunity costs magnify the actual cost of the 5.50% option. $12,000 could provide for a dream vacation, an investment, paying off credit card debt, or other value.
But can the MLO quantify the opportunity cost in a relevant illustration? In the example, that is the lost use of $12,000 compared to the 6.00% quote.
Quadrilateral Analysis, Square the Loan Presentation
Analyzing the differences in P&I, upfront finance charges, and amortization is a good start. However, the loan presentation may introduce a fourth dimension, “lost opportunity.” Lost opportunity analysis will square the loan comparison by accounting for the opportunity cost of the permanent buydown fee.
Lost opportunity or opportunity costs quantify the lost benefit of resources. For example, if the borrower spends $12,000 to buy down the rate, what does the loss of the $12,000 represent to the borrower?
To illustrate lost opportunity and aim for simplicity, go sans inflation, sans tax ramifications (The Fifth Dimension). Inflation may significantly impact these comparisons (The future value of the lower interest rate and the principal is tempered by inflation) by weighting today’s dollar value against the declining value of tomorrow’s dollar. However, inflation and tax considerations or real and nominal measures are a bridge too far for 99% of your transactions. If the applicant can calculate and appreciate real return, they probably do not need the assistance of an MLO to make a loan comparison.
Illustrating Opportunity Cost in a Loan Comparison
Consider a purchase money loan comparison—a $600,000 loan amount. The illustration compares 6.00% to 5.50%. Assume the 5.50% includes a discount cost of 200 BPS. The first illustration is the $600,000 loan at 5.50%. The P&I is $3406.73. However, the 5.50% rate generates a $12,000 finance cost that the 6.00% quote does not.
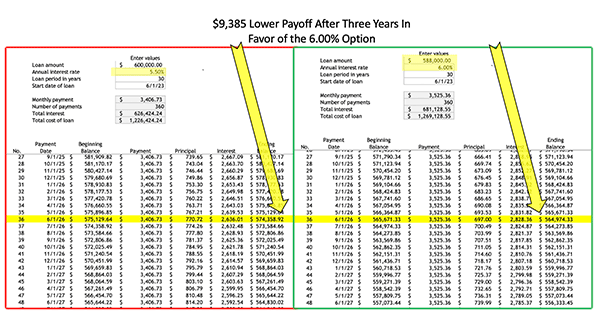
In a comparative analysis, to factor in the lost opportunity (lost use) of the permanent buydown costs ($12,000), when illustrating the 6.00% loan, discount the loan amount by the $12,000 buydown cost to square the opportunity cost. Instead of illustrating $600,000 at 6.00%, the illustration depicts a loan amount of $588,000 at 6.00%.
The lower loan amount at 6.00% reflects the opportunity cost in comparison to the 5.50% with the upfront discount. Now run the numbers. Compared to the 5.50% rate, the monthly P&I savings drops to $119.
Look again at the numbers. Assume the applicant pays the loan in full at the end of year three:
The 6.00% loan payoff is $564,974. The 5.50% loan payoff is $574,359 or $9,385 more than the 6.00% payoff. The P&I comparison shows that over the 36 months, the applicant saves $119 monthly or $4,284 compared to the 6.00 rate. In this example, the P&I savings is hardly worth the price of the buydown. When factoring in opportunity costs, the 5.50% financing projected costs are $5101 more than the 6.00% instead of the $2995 sum without the opportunity loss. See the Figures 1.0 and 1.1.
Just for fun, repeat the comparison for five, seven, and ten years. Again, opportunity costs provide more significant insights into the loan comparison if presented accurately.
Which Is The Better Loan Presentation?
A person would like to see the ocean view from a cliff edge.
Blindfold the consumer and suggest they walk to the edge of a cliff but be careful not to go too far and fall off.
Or suggest the consumer move towards the cliff, sans blindfold, but keep at least five paces from the edge.
The blindfolded consumer gets the following loan presentation, “It looks like you can save some money,” “Option two looks better,” and “In my opinion, you should refinance.” Or the worst, “You can always refinance.”
In the unblindfolded state, the consumer gets a presentation that adequately quantifies the risks.
$12,000, $5,101, and $119 monthly savings are not just meaningless numbers. Instead, accurate and comprehensible numbers are a love language, increasing the likelihood that the consumer understands the quantified options and is thus empowered to make an informed credit decision. Furthermore, driven by your excellent presentation, you have amplified customer buy-in and loyalty.
Some applicants will object and argue that there is also a lost opportunity in sinking $12,000 “into the mortgage” by borrowing less. After all, they could put the $12,000 in the stock market. Right, enough said. No arguments. Make the presentation and let the numbers do the talking.
Is lost opportunity a bridge too far? Yes, for some, and no for others. Triangulating the financing costs is as easy as one, two, three. Squaring the illustration is more complex. Communicating either analysis can be challenging. But not nearly as challenging as losing business and a lack of customer loyalty.
The loan presentation is a smoke-free zone. At the least, an amortization projection could be part of every loan presentation and helps to provide a clearer picture of cost-benefits for refinance and purchase transactions. Eliminate any appearance of smoke and mirrors from your loan presentations and clear your way to success.
Do you have a great value proposition you’d like to get in front of thousands of loan officers? Are you looking for talent?

BEHIND THE SCENES – Positive Development, No More Pesky “Little” Medical Collections
Have medical debt? Anything already paid or under $500 should no longer be on your credit report
From the CFPB
MAY 08, 2023
Nearly 1-in-5 households in the United States has reported having some form of overdue medical debt. Patients and their families are contacted by debt collectors about medical bills more than any other type of debt, and it commonly results in negative information appearing on credit records. In fact, in 2021, 43 million people had allegedly unpaid medical bills on their credit reports.
Congress, federal agencies, and others have taken steps to respond to the medical debt crisis confronting millions of families. Congress passed the No Surprises Act to help protect Americans from certain unexpected medical bills, including surprise medical bills for emergency services from out-of-network providers. In addition, the CFPB told debt collectors and consumer credit reporting companies that they can’t collect, furnish, or report any invalid medical debt.
The three nationwide credit reporting companies – Equifax, Experian, and TransUnion – also removed all paid medical debts from consumer credit reports and those less than a year old. They have also taken steps to remove all medical collections under $500. This last step went into effect on April 11, 2023, and with this change, it’s estimated that roughly half of those with medical debt on their reports will have it removed from their credit history.
If you’re one of the millions of Americans with overdue medical bills, you may be able to take steps to ensure this information no longer affects your credit, including your access to employment and housing.
Check your credit report
The changes recently introduced by the nationwide credit reporting companies cover all medical bills reported to them by debt collectors, also known as medical collections. One of the first steps you can take is to check your credit reports for any outstanding medical bills. Currently, Equifax, Experian, and TransUnion are offering free online credit reports once a week through AnnualCreditReport.com.
- If you previously had a medical collection under $500, a paid medical collection, or a collection less than a year old on your credit report, check to make sure they no longer appear on your reports. Be aware, however, that this doesn’t include credit card collections, even if you used your credit cardto pay for a medical expense under $500.
- Also, while you’re looking at your reports, check for any other information that might be inaccurate.
- If you find a medical collection under $500, a paid medical collection, a collection less than a year old, or errors on your report, you can dispute that information with the credit reporting company.
In addition, the nationwide credit reporting companies have announced that they’re extending the amount of time you have to dispute, negotiate, or pay for any outstanding bills before they can be reported. Previously, unpaid medical bills were generally furnished to credit reporting companies after 60 to 120 days, but the nationwide credit reporting companies are now waiting one year from the time you saw a doctor before they’re allowing medical debt to appear on your credit report. If you’re unable to pay your medical bills, you may qualify for financial assistance programs, often called “charity care.”
Can’t resolve medical debt concerns? Submit a complaint
We expect that the No Surprises Act, the recent actions by credit reporting companies, and the CFPB’s own actions and guidance will reduce the challenges many families face after they receive medical care. The CFPB also wants to ensure that the credit reporting companies are doing their jobs to investigate any information that people dispute.
CFPB BLOG – Forward to Consumers
Tip of the Week – Sign up for 2023 CE
Webinars start this week
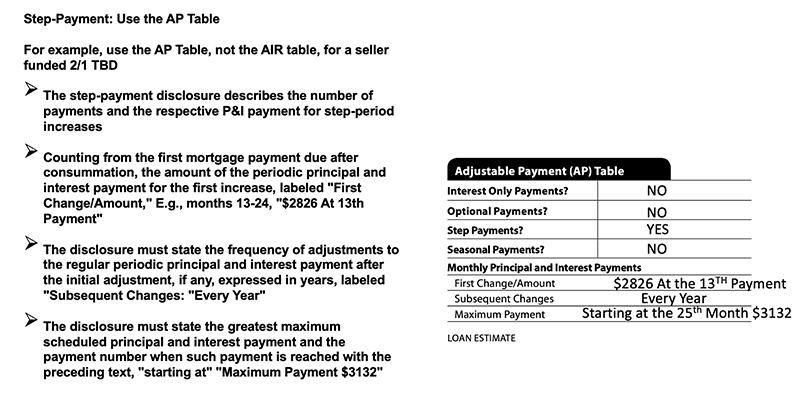
Temporary Buydown Confusion
What is the difference between step-payment and step-rate disclosure? Can you explain a lender or borrower-paid step-rate disclosure using the AIR Table? What should the AP Table disclose?
Join us in 2023 for a comprehensive review of the temporary buydowns.